During my GBDA203 course (taught by Daniel Harley), we were tasked with recording
and documenting our usage of a piece of technology. I chose to use headphones, as
I use them daily and cannot live without them.
Headphones hold an interesting history, not being changed into everyday usage till
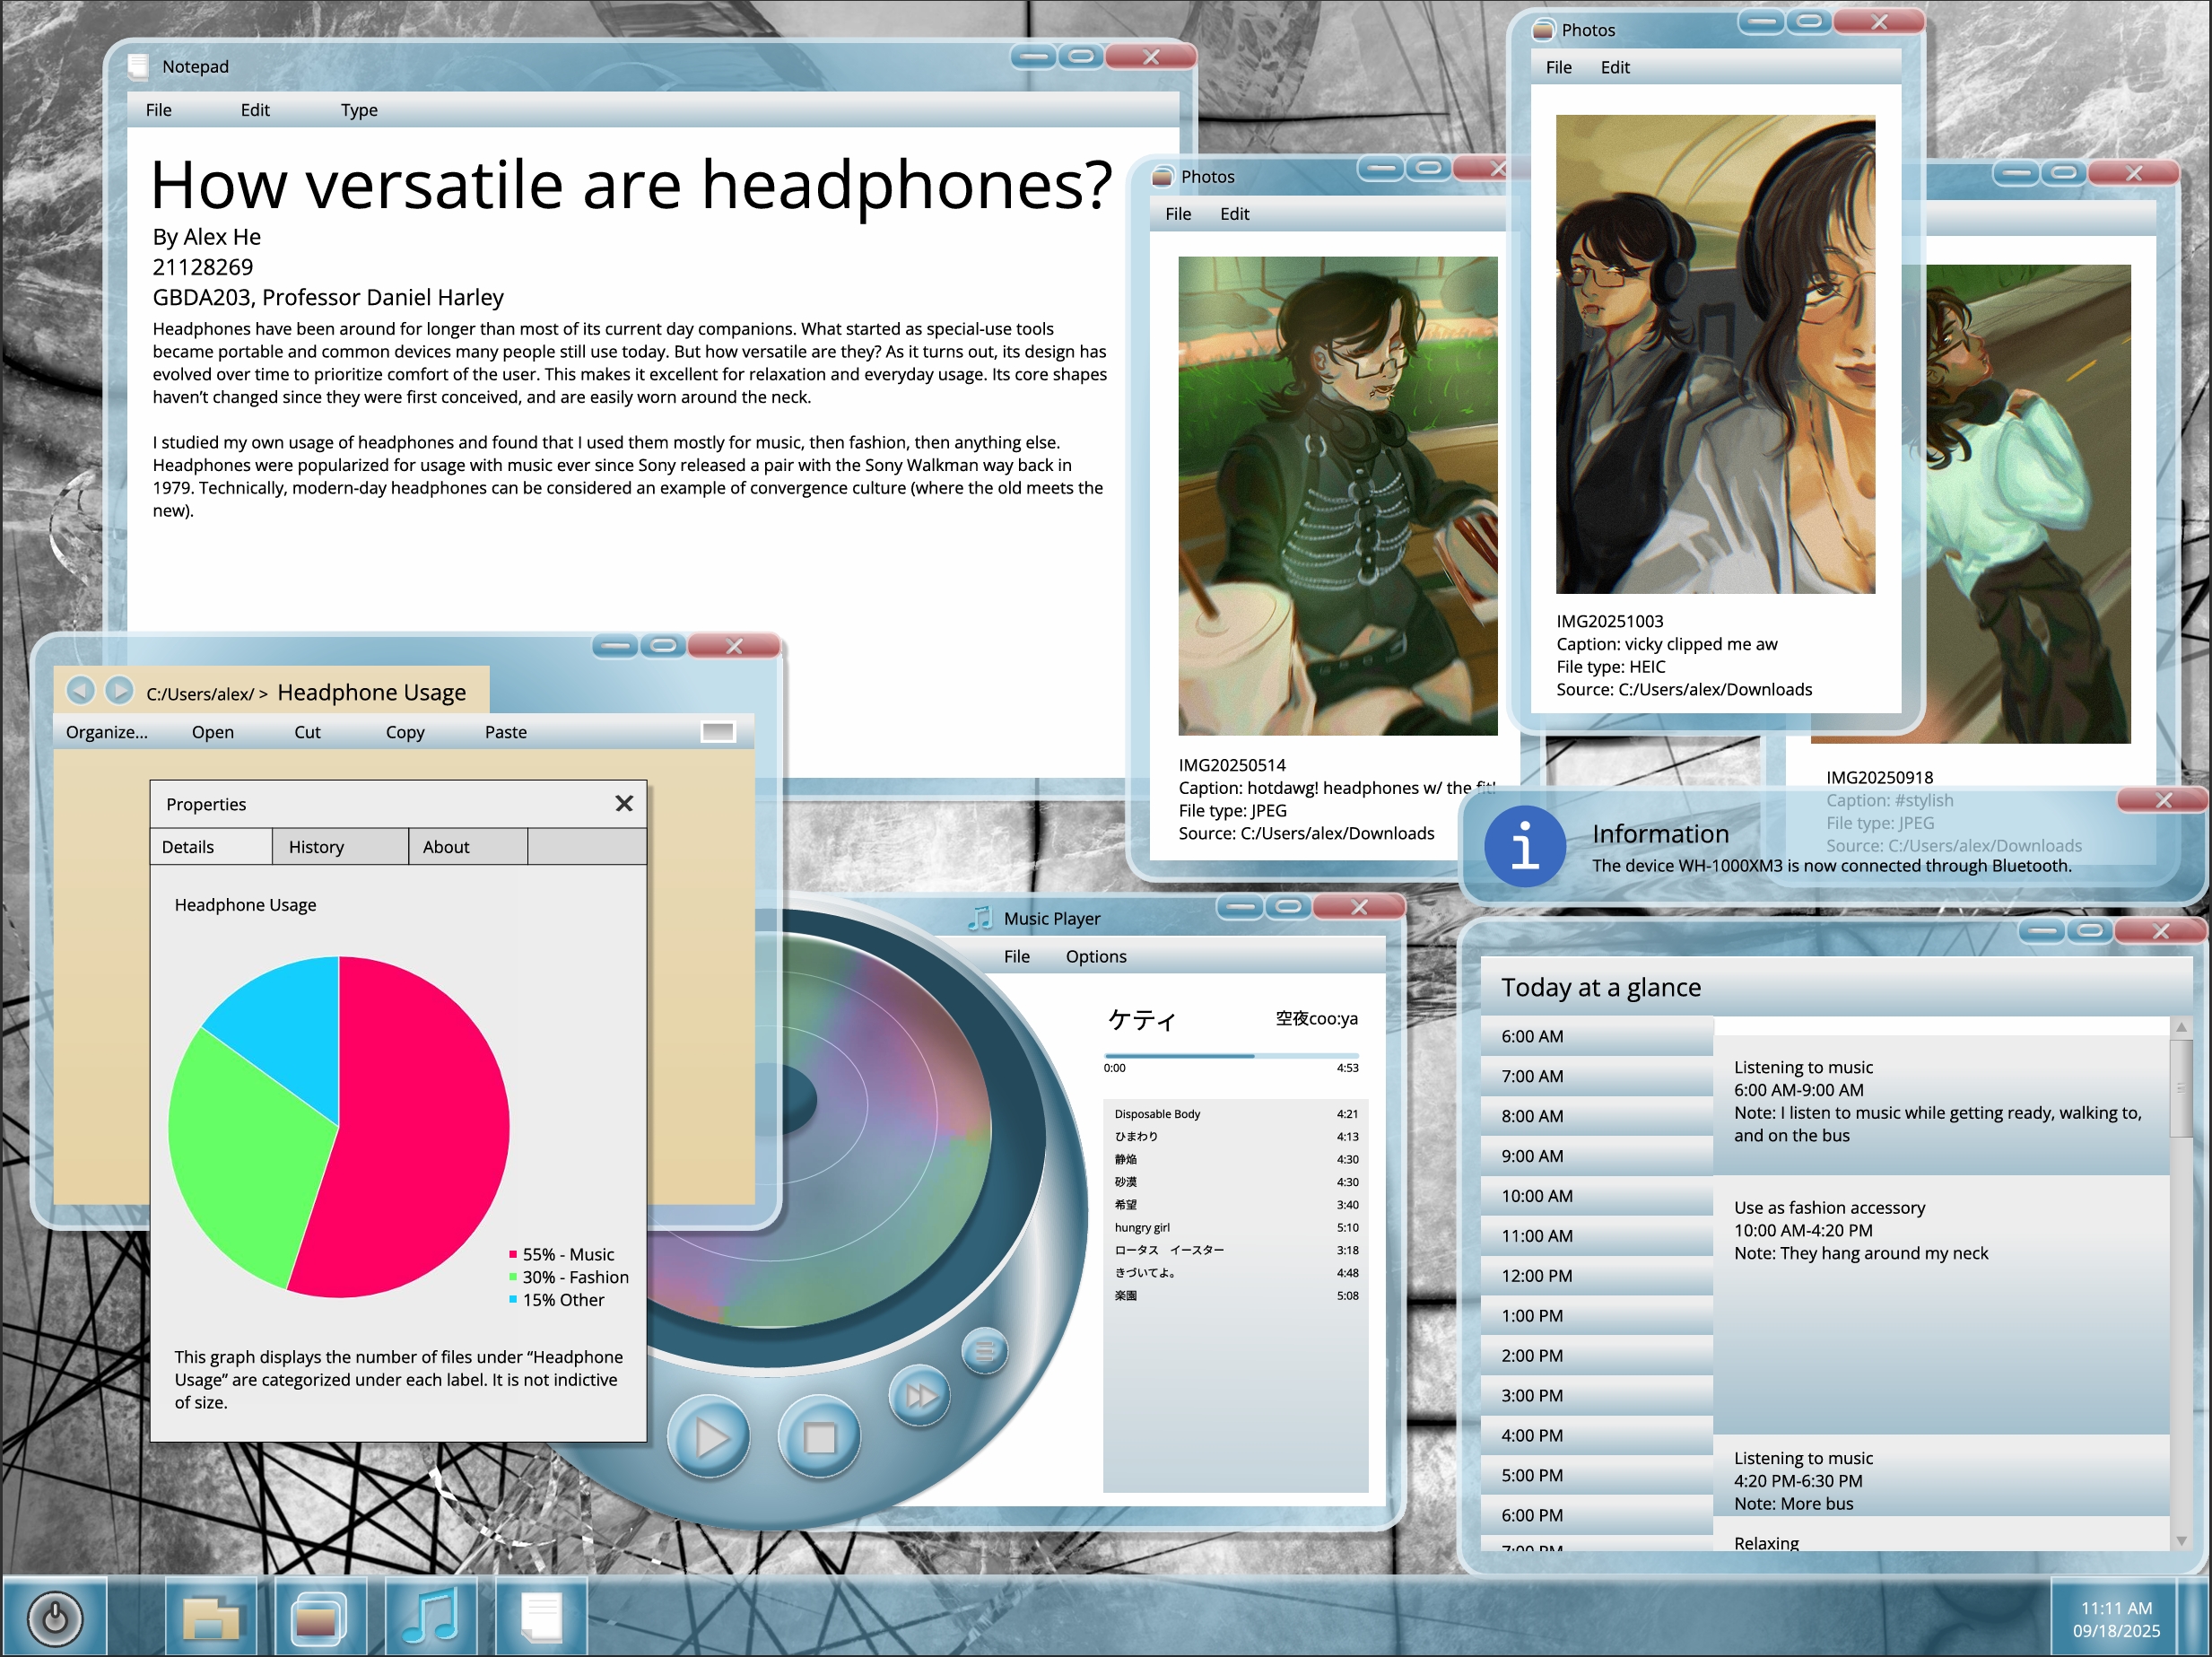
Sony released the Walkman. This was siimilar to computers, so I decided to create
the required infographic portion in a Windows 7 style. The graphic contains not
only solid numbers, but also clever graphics to indicate each part of data. As such,
the result is a fun yet informative graphic from observing my headphone usage. There is
also a partner essay, which can be read here if you are interested.
This infographic was my first attempt at using Figma, an intuitive design software.
The illustrations were done by myself, however I was already familiar with the
program I used. I found myself more confident in my design skills and happy with
the result! It was a good learning opportunity to move away from the Adobe Suite,
which I was already comfortable with. I believe being able to be flexible in the
programs and tools one uses is essential to being a designer.
Numbers and charts don't need to be boring. In fact, they can be engaging while
still being relevant to the information portrayed. I believe this aspect will be
crucial to continue the relationship between information and the public in the
future.